See the CFO Dashboard in Action
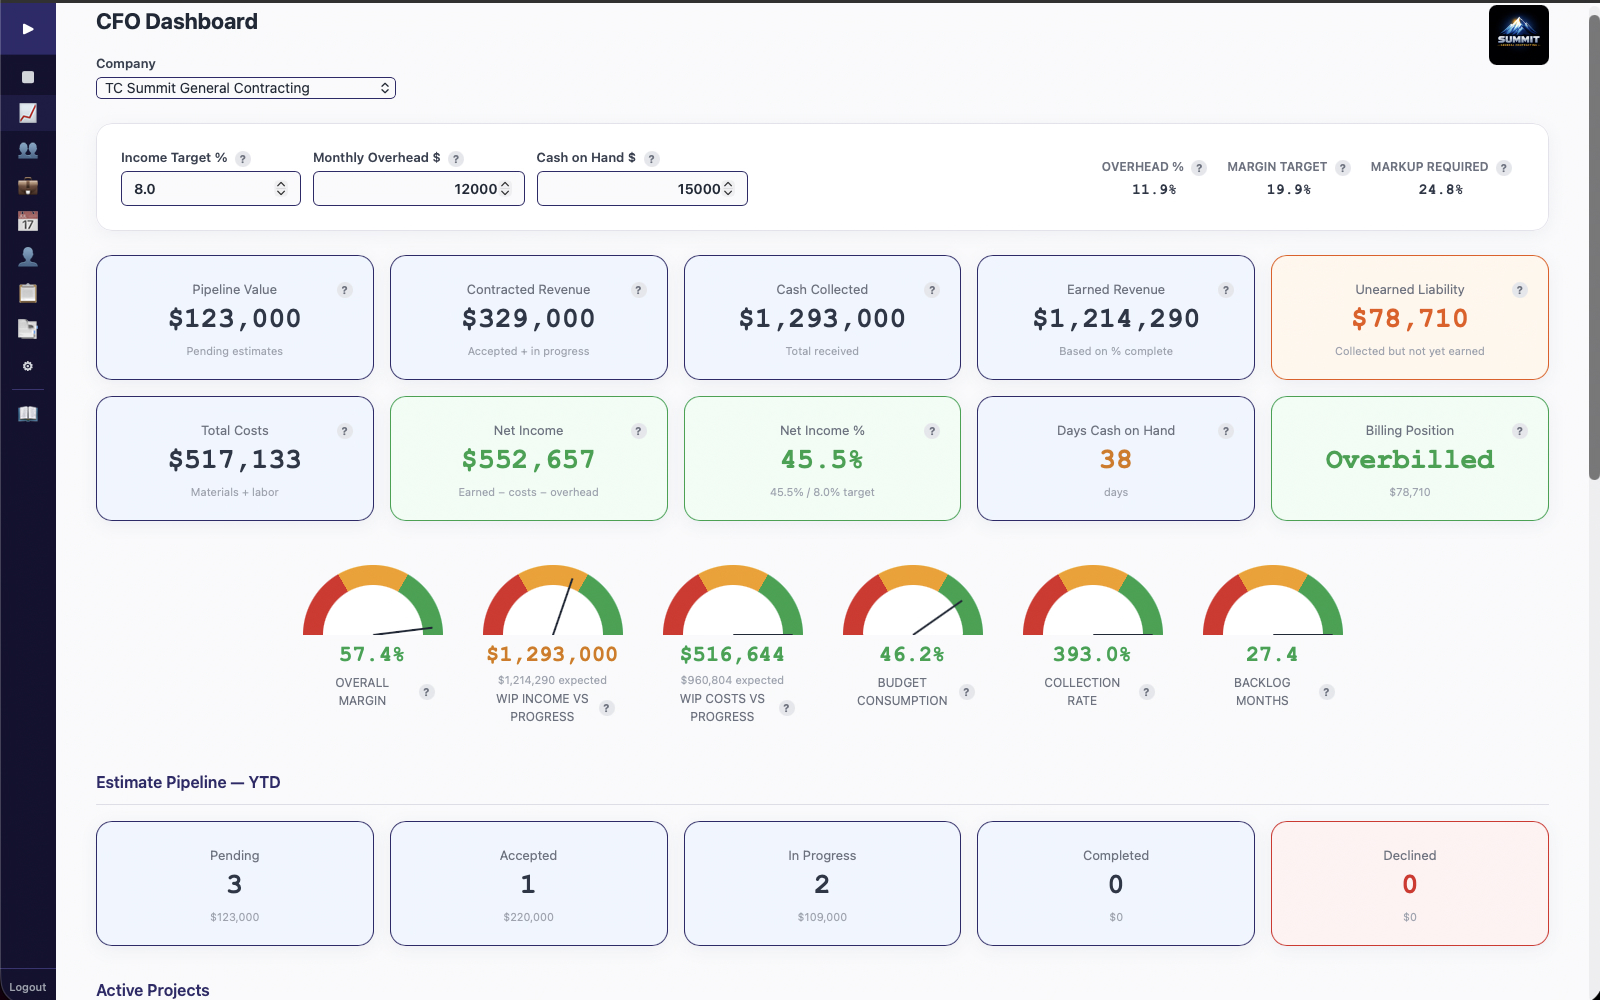
Live KPIs, health gauges, and a progressive financial education system — not a paywall, a learning path. See revenue, margins, WIP (work in progress), and cash position in real time.
You finish a $65,000 job and feel good about it — until your bookkeeper tells you the actual cost was $61,000 and your margin was 6%. You needed 20% to cover overhead.
But by then, you've already bid three more jobs at the same rates. That's how contractors go broke while staying busy — doing $300,000 a year in revenue with a $15,000 margin that doesn't cover your truck payment.
The problem isn't that you can't do the work. The problem is that you find out a job lost money after it's too late to do anything about it. A CFO Dashboard shows you the financial truth while there's still time to act.
Here's what the CFO Dashboard shows you — mid-job — so you can course-correct before the final invoice.
Every tool in BDB feeds the dashboard. No manual data entry. No spreadsheets. Just real numbers from real work.
Time entries from Timekeeper, receipts from Receipt Capture, estimates from Field Estimating, and invoices — all feed into live KPIs automatically. Nothing to type. Nothing to reconcile manually.
Configurable thresholds turn metrics into traffic-light signals. Spot problems before they become emergencies. If a job's costs hit 80% of budget at 50% completion, you see red immediately — not after the final invoice.
A 3-tier system (Starter, Intermediate, Full CFO) doesn't just show numbers — it explains what they mean. Margin isn't just a percentage; the dashboard tells you what it means for your business and what to do about it.
See cost per lead, conversion rates, and ROI per marketing source. Know which channels bring profitable jobs — not just leads. Stop spending money on marketing that doesn't produce revenue.
The CFO Dashboard grows with you. BDB controls your tier based on your readiness — not your willingness to pay. All tiers are included in the $69/month price.
You're not being upsold. You're being educated. We advance your tier when you're ready for deeper financial insights — not when you upgrade to a higher plan. There is no higher plan.
For owners getting their financial footing. See the numbers that matter most, with plain-English explanations of what they mean.
For owners who understand the basics and want to see trends, compare jobs, and spot patterns in their costs.
For owners ready to make data-driven strategic decisions. The same financial visibility that companies 10x your size rely on.
Most competitors either don't have a dashboard or give you raw numbers with no context. BDB gives you financial visibility with education built in.
Not just charts — context and guidance. Every metric comes with an explanation of what it means and what to do about it. Margin isn't a number; it's an action item.
Set your own red/yellow/green thresholds. What's healthy for a $2M company might be alarming for a $500K company. The gauges adapt to your business.
WIP (work in progress) shows you the financial status of every active job — not just completed ones. See which jobs are on budget and which are bleeding money right now.
Cost per lead, conversion rates, and ROI per marketing source. Know if your Google Ads spend is producing profitable jobs or just expensive leads.
BDB advances your tier when you're ready for deeper insights. This isn't a feature gate. There's one price ($69/mo) and one plan. All three tiers are included.
No manual data entry. Timekeeper, Receipt Capture, Field Estimating, and invoicing all feed the dashboard. The numbers update as your crew works.
The CFO Dashboard is the culmination of the "Built Backward From Your Books" philosophy. Every time entry, receipt, estimate, and invoice that syncs to QuickBooks Online also feeds the dashboard. This is the financial truth of your business, updated in real time.
See revenue, margins, WIP, and cash position in real time. A progressive financial education system that grows with your business. Six tools, 20 users, $69/month. Founder's rate locked when you sign up before June 30, 2026.
Founder's Pricing: $69/mo for 20 users. Retail $149/mo. Founder's rate locked when you sign up before June 30, 2026.